

 |
| Pixabay.com |
What is a visual learner?
A visual learner is someone who needs to process and assimilate information in a visual way. Although, most people think visually some of the times, visual learners must rely heavily on visual techniques to process the world around them. Visual learners tend to use their right brain more and respond to the world visually and spatially.
Visual learner strategies
As an undergraduate major in Computer Science, I employed many visual techniques to remember the commands of the 9 different computer languages I had to master. When I got to my graduate studies in business school, I had to use visual strategies to manage the demands of not only assimilating large amounts of information but packaging and presenting in class. Then years later, in my doctoral program, I employed multiple visual strategies to help me manage the massive amounts of research data that had to be digested weekly.
When I became a teacher, I pulled from my own learning experiences as a student. Each semester, I aimed to deliver a class that fostered the most effective learning experience for the broadest group of students possible. This was because I knew from my own background that students learned differently. As a teacher, I specifically wanted my lectures to address the visual learner in my courses because I didn't get much of this in my own education.
As I teach my online courses today, the same question still remains, how do I as the teacher develop a course that addresses the visual learning needs of my students? This given the fact that delivering effective course materials to the visual learner is even more challenging in online courses. This is mainly because you are depending on the interaction that students will have through the technology.
In this article, I'll focus on one of my favorite visual learning strategies which is using graphic organizers.
What are graphic organizers?
Graphic organizers are diagrams that show students a bird's eye view of how concepts within a given topic relate to one another. This type of view is important for visual learners because they need to know the connection amongst concepts in addition to the details. The diagrams help students remember and grasp concepts. Most graphic organizers contain simple shapes or icons (pictures) that are representative of the information they reference. The common types of graphic organizers that I use are listed below:
Concept Maps
A concept map is a type of graphic organizer that is used to show topics, subtopics and how they are related. With a concept map, you can show how knowledge is organized within a topic. A typical concept map has circles with lines that connect the circles. The lines indicate how topics relate to one another.
Technology Strategy:
 |
| A simple CONCEPT MAP that shows how living things are related. (WikiMedia Commons) |
Word and PowerPoint are good tools for making concept maps. For instance, most teachers typically will use PowerPoint lecture slides from the textbook which are far too linear and sequential. When I use PowerPoint slides, I like to create an online lesson book in my LMS with a concept map diagram that organizes the topic and subtopics. I then place links in the circles that students can click on for the information contained in the PowerPoint slides.
You can also create a concept map at the end of a lesson so that students can visualize the topics/subtopics they learned about. Then, encourage your students to use the concept maps as a quick reference for studying or completing assignments. Another way to encourage the use of concept maps is to create online PDF lecture notes that use sidebars and call-outs (small windows). So when students click on a word or phrase, it links them to the concept map page in the lesson. They can then see what overall concept the word/phrase belongs to. Giving students a graphical depiction of how concepts are organized gives them the visual tools they need to digest the material.
You can also create a concept map at the end of a lesson so that students can visualize the topics/subtopics they learned about. Then, encourage your students to use the concept maps as a quick reference for studying or completing assignments. Another way to encourage the use of concept maps is to create online PDF lecture notes that use sidebars and call-outs (small windows). So when students click on a word or phrase, it links them to the concept map page in the lesson. They can then see what overall concept the word/phrase belongs to. Giving students a graphical depiction of how concepts are organized gives them the visual tools they need to digest the material.
MindMaps
Mind maps are visual representations of the information related to a single topic. They differ from concept maps which typically deal with multiple topics that are related to each other. Most mind maps typically contain a boxed topic or concept in the middle of the page that then breaks out into branches (lines). Mind maps are good for providing the hierarchy of subtopics within a topic. They are particularly helpful when brainstorming the subtopics that need to be covered from a main topic.
 |
| A MINDMAP about the Human Growth Hormone (WikiMedia Commons) |
Technology Strategy:
I typically use mind maps in my computer course lectures to help students understand topics such as networking. In my computer course, networking is a huge topic and a difficult one for most students to understand outright. So, my strategy is to use mind maps to construct the topic and its subtopics together with students so that I can pinpoint how they are internalizing the information.
In one assignment, I'll have students read the chapter on networking which contains background information on what networks are, why they are important and the basic types. The chapter reading also contains some of the necessary jargon about networking. Then, I have the students visit my mind map on Mindmeister.com. There they can add on a branch and expand the concept of networking as they understand it. They then have to explain their addition to the mind map.
This type of assignment asks students to interpret new information they learn about in their own way by sharing their thought process about the topic. The collaborative nature of such an assignment allows students to feel the support of learning a new topic (esp. a harder one) together.
Webbings
Webbings (also called webs) look much like mind maps, but differ in that they arrange topics hierarchically with "nodes" in a radial sense instead of a linear sense with branches. Sometimes webbings look like spider webs. Webbings are commonly used for planning and brainstorming about a topic. To start a webbing, you write a topic or central idea in the middle of the page, then you draw arrows to show different categories or subtopics around the central idea.
There are some great examples of webbings used for brainstorming activities at Inspiration Software, Inc. (http://www.inspiration.com/visual-learning/brainstorming-webs). One of the examples from the language arts area is about MacBeth. Notice how the web appears in a radial format instead of branches. Also some of the nodes have call-out boxes which can be used to provide additional text and links.
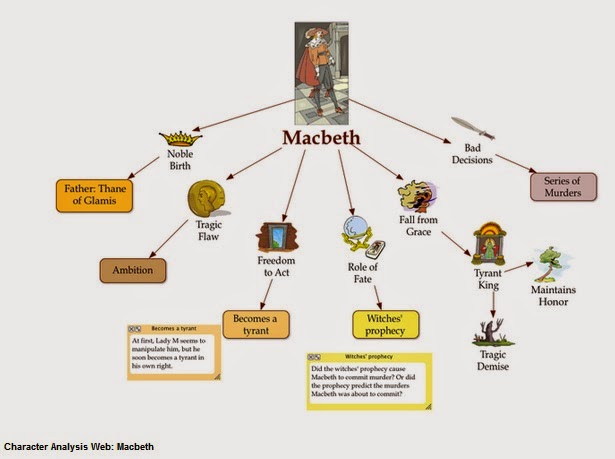 |
| A sample WEBBING about MacBeth from Inspiration.com |
Technology Strategy:
Here's an idea that you can try as a group assignment in your class. I used this in the past for my web design courses in which students developed websites in teams. Ask teams of students to come up with webbings for their final group projects. Students can start their webbings at an online site such as Mindmeister and then can add on nodes as the semester goes along. This works best if the final project is in stages throughout the entire semester. This assignment is great because it encourages more fluid thinking and helps students to avoid road blocks in their development. With the webbings, they can generate ideas very quickly and collaborate with each other asychronously. (not in real-time)Flowcharts
Flowcharts are diagrams that show processes in logical order. Flowcharts have simple shapes such as squares, diamonds, circles and rectangles connected with arrows. Each shape in a flowchart can explain the part of a process or procedure students must learn. In addition, flowcharts can provide students with decision making models to be used in a procedure of steps. The nice feature about flowcharts is that students can use them as a guide when completing an assignment.
Below is a simple flowchart that illustrates the decision process that someone might engage in if a lamp does not work. Notice the use of color to accentuate the different types of decisions that are part of the process. For instance, the yellow diamonds are questions that the person might ask while the green boxes represent actions.
 |
| A simple FLOWCHART to decide whether to repair a lamp. (WikiMedia Commons) |
Technology Strategy:
In my courses, I use flowcharts in many of my Word and PowerPoint lectures and handouts. Both software have the SmartArt feature which allows you to create pre-made flowcharts by just clicking on the type of diagram you want. You then can add text, color and other attributes that you need.I teach math, computers and business courses and so these subjects really lend themselves well to showing the logical steps of a concept. But flowcharts can really be adapted to any subject that would involve multiple steps or ways at completing a tasks. For instance, decorating a cake in culinary class; analyzing a soil sample in horticulture class; making a digital print in photography class or discussing the impact of a war in history class.
In my course LMS (Moodle), I have used Web-based documents made into flowcharts to present links for students to click on. For example, for a lesson on Usability and Accessibility for a website design class, I created a flowchart to teach students a checklist that ensured that their web-created documents where accessible to the disabled. Students followed the flowchart by clicking on each step and its explanation.
Image credits: Pixabay, WikiMedia Commons)
Resources I recommend on graphic organizers:
- "How to use graphic organizers for teaching writing, learning and understanding across the curriculum "
- Graphic Organizer Software online:
Bubble.us (www.bubbl.us)
Mindomo (www.mindomo.com)
MindMeister, (www.mindmeister.com)
XMind (www.XMind.net)
- Microsoft Office 2010
(*It's cheaper to just get the entire package instead of MS Word and MS PowerPoint alone)
- Microsoft Office 2013
(* This is the newer version...I actually like the 2010 but thought I'd just add the latest version)
